Overview
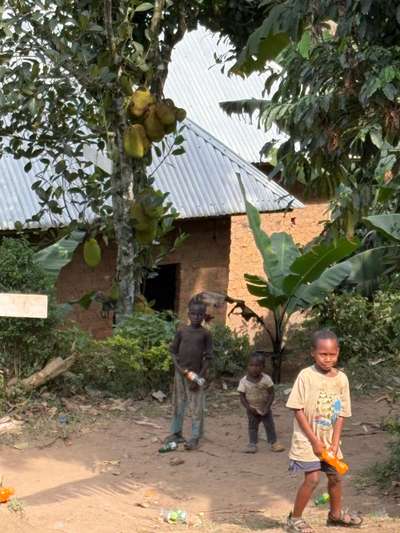
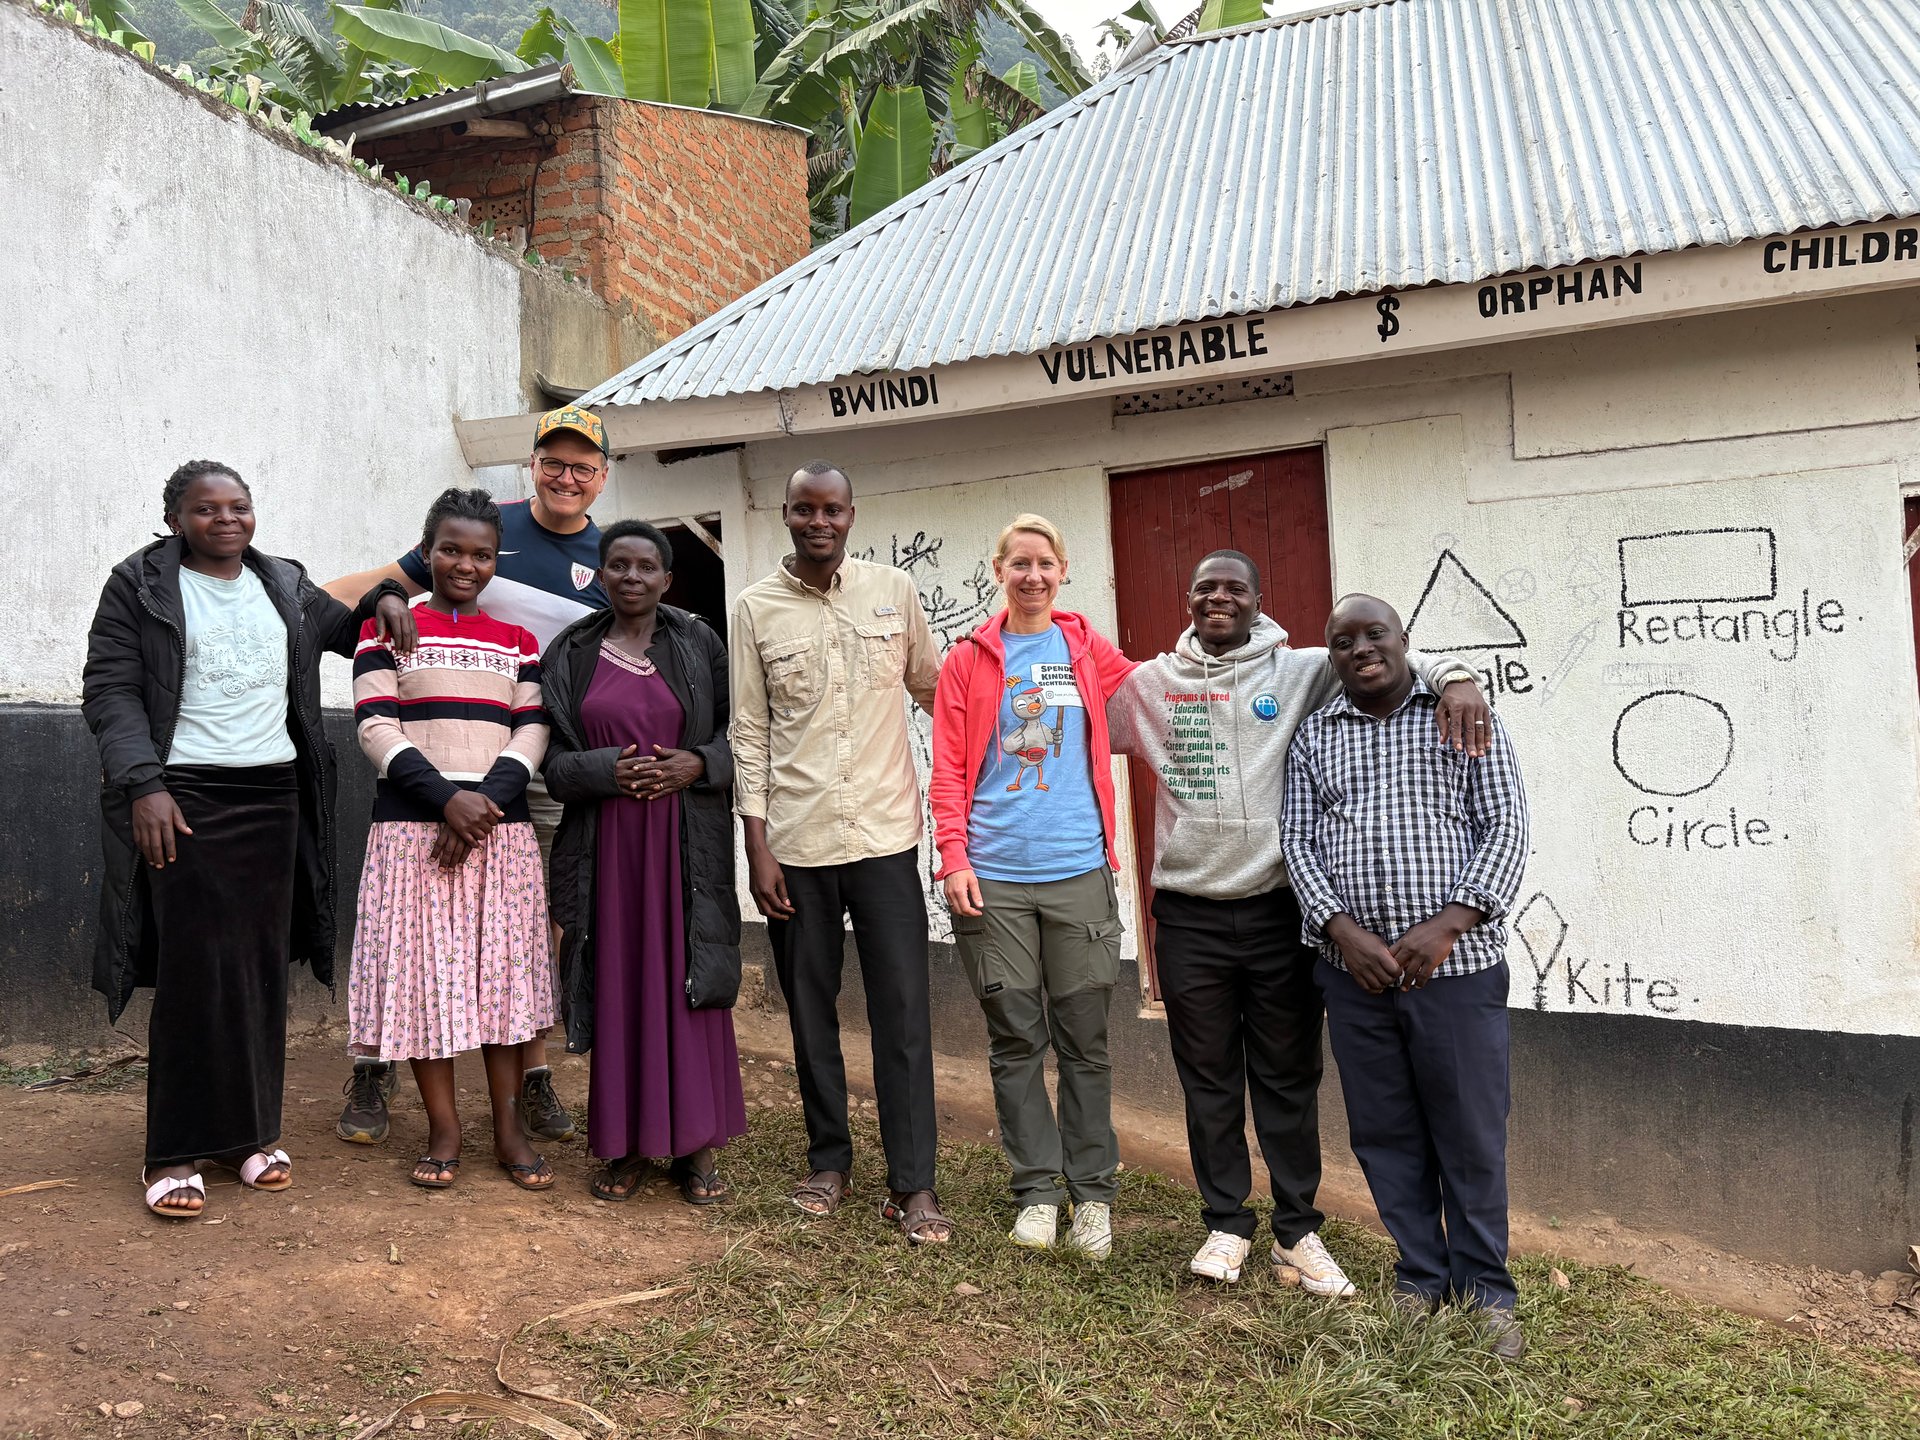
On June 21, 2026, I sat with a group of children near the Buhoma orphanage in southwest Uganda — children who had come over shyly, drawn by the activity, wearing clothes that did not fit well and shoes that had seen better seasons. The statistics for Uganda's poverty profile are compiled in Kampala and Geneva, calculated from household surveys and satellite data and national accounts. What they measure — inadequate nutrition, limited access to quality education, dependence on subsistence agriculture with no cash buffer — was visible right there in Buhoma that afternoon. The numbers give it scale; the field gives it faces.
Uganda's Human Development Index score for 2024 is 0.582, placing the country 157th of 193 in the global ranking. That score represents the composite of three dimensions: a long and healthy life (measured by life expectancy), access to knowledge (measured by mean and expected years of schooling), and a decent standard of living (measured by gross national income per capita). Uganda's medium HDI classification reflects genuine progress over recent decades — the country was lower-ranked a generation ago — but also the distance remaining to the living standards that most Ugandans aspire to for their children.
The Gini coefficient of 42.7 tells the inequality dimension of Uganda's poverty story. Uganda is not a country with uniformly low incomes — it is a country with significant income dispersion between the formal urban economy and the rural subsistence sector, between households connected to the tourism and services economy in places like Buhoma and those farming without market access in remote areas, between the 18.7% of the population employed in industry and services and the 46.5% in agriculture.
Understanding the 2.7% Unemployment Figure
Uganda's officially recorded unemployment rate of 2.7% is one of the lowest in sub-Saharan Africa and requires careful interpretation. The International Labour Organization definition of unemployment — not working, available for work, and actively seeking work — produces a very low figure in Uganda because most adults who are not employed in formal or informal paid work are engaged in subsistence agriculture. They are not counted as unemployed because they are occupied: growing food, maintaining a household, farming a plot.
The Labour Force Survey 2024 places 75.5% of Uganda's working-age population as employed. Of those, 46.5% work in agriculture — overwhelmingly subsistence farming with limited market integration. A further 34.8% work in services and 18.7% in industry. The services category covers a wide range from formal employment in Kampala's business district to informal hawking in a small-town market. The headline employment figures describe a labor market that is fully occupied in the technical sense but where the majority of employment generates subsistence rather than accumulation.
This is why the 33% of households classified by the 2024 National Population and Housing Census as being in the subsistence economy is such an important parallel indicator. These are households whose primary economic activity produces for direct consumption with no significant cash income. They are employed in the technical sense — farming, cooking, caring — but not integrated into the cash economy in ways that generate the income growth that poverty reduction requires.
The Gini Coefficient and What It Means
A Gini coefficient of 42.7 places Uganda in the moderately unequal category globally — higher inequality than most of Europe and Central Asia, lower than several Latin American countries, roughly comparable to a number of African peers. The figure is most meaningful in what it implies about the distribution of Uganda's GDP per capita of USD 1,375: that figure is an average, and the distribution around that average is uneven enough that the median experience of a Ugandan household is considerably below that average income.
The geographic dimension of Uganda's inequality is sharp. Kampala and other urban centers have per capita incomes substantially above the national average; the Northern and Eastern regions — which also experienced the greatest conflict disruption in the 1980s through 2000s — have per capita incomes substantially below it. Inequality in Uganda is also sectoral: the formal private sector and government employment provide incomes far above the national average, while subsistence agriculture produces no measurable cash income at all.
For development programming, inequality matters because it affects the translation of economic growth into poverty reduction. In a highly unequal economy, GDP growth can increase faster than the incomes of the poorest households — growth is captured by those already in the formal economy and those with assets to invest. Uganda's development plans explicitly address the need for inclusive growth: infrastructure investment that connects remote communities to markets, education quality improvements that give rural children access to formal employment, and financial inclusion measures that bring subsistence households into the cash economy.
HDI Components: Life Expectancy, Education, Income
Uganda's HDI score of 0.582 decomposes into three components that tell distinct stories. Life expectancy at birth has improved substantially over recent decades — from very low levels during the HIV/AIDS epidemic peak in the early 1990s to a current figure reflecting improved healthcare access, antiretroviral treatment coverage, and maternal health improvements. The health dimension of Uganda's HDI is its strongest performing component relative to income level.
The education dimension shows Uganda's success in expanding access to primary education — the Universal Primary Education programme launched in 1997 brought school enrollment rates sharply upward — alongside persistent quality and completion challenges. Mean years of schooling and expected years of schooling both remain below the level that Uganda's income class would predict if quality were uniform. A child who attends primary school in an overcrowded rural classroom may accumulate years of schooling without acquiring the literacy and numeracy skills that those years nominally represent.
The income dimension is the most direct reflection of Uganda's GDP per capita of USD 1,375. This places Uganda among lower-middle-income economies globally, above the low-income threshold but far below the levels at which most development indicators show consistent improvement across all dimensions. The poverty line of USD 1.77 per person per day — the level below which households are considered poor in Uganda — provides context: at USD 1,375 per capita per year (approximately USD 3.77 per day), the average Ugandan is modestly above the poverty line but with limited buffer against shocks.
The Refugee Economy Overlay
Uganda's poverty statistics describe the national population but the economy also includes 2,031,697 refugees whose welfare profiles are generally significantly below the national average. Refugees are not included in Uganda's national household survey poverty statistics, but they live in the same districts, use the same health facilities, and compete for the same resources as host community households. The 712,000 refugees in IPC Phase 3 food crisis in 2026 are experiencing welfare levels far below Uganda's national poverty line.
The interaction between the refugee and host community economies is complex. Large refugee settlements generate economic activity — markets, services, employment for host community members — that may raise local incomes. But they also stress infrastructure, natural resources, and public services in ways that impose costs on host communities. The net effect on host community poverty depends heavily on whether humanitarian programming investment in settlement districts flows to host communities as well as to refugees, as Uganda's inclusive settlement policy intends.
From the field
Frequently asked questions
What is Uganda's HDI rank in 2024?
Uganda ranks 157th out of 193 countries in the 2024 Human Development Index, with a score of 0.582, placing it in the medium human development category. The score reflects genuine progress over recent decades but also the significant distance remaining to the development standards most Ugandans aspire to for their families.
What is Uganda's Gini coefficient?
Uganda's Gini coefficient is 42.7, indicating moderate inequality. The figure reflects sharp disparities between Kampala's formal economy and rural subsistence farming, between northern regions recovering from conflict and the more developed south, and between formal sector workers and the 33% of households classified as subsistence economy participants.
What is Uganda's unemployment rate in 2024?
Uganda's official unemployment rate is 2.7%, reflecting the ILO definition. The low rate does not mean most Ugandans have secure cash incomes: 46.5% work in agriculture — predominantly subsistence farming — and 33% of households are classified as subsistence economy participants with minimal cash income despite being technically employed.
What is Uganda's GDP per capita in 2024?
Uganda's GDP per capita is approximately USD 1,375 in 2024. This average masks significant variation — the national poverty line is USD 1.77 per person per day, and a substantial share of households earns at or near that level. The average Ugandan has a modest buffer above the poverty line but limited resilience to income shocks.
What does the Uganda National Household Survey 2023/24 show about poverty?
The UNHS 2023/24 provides the most recent comprehensive household welfare data for Uganda. Combined with the 2024 Labour Force Survey and National Population and Housing Census data, it shows declining aggregate poverty rates since 2016/17, but persistent structural inequality and subsistence dependency as central features of Uganda's development challenge.