Overview
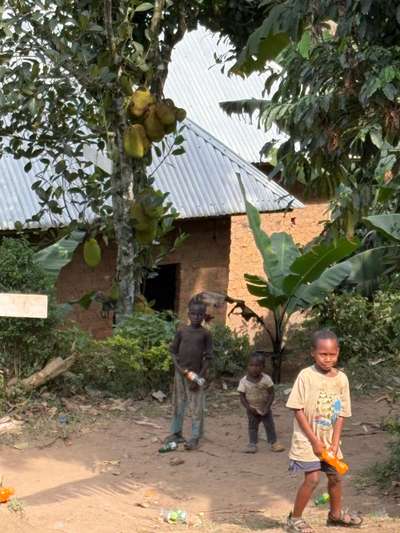
On June 21, 2026, in Buhoma, a child sat across from me and ate. She was from the neighborhood near the orphanage — one of several who had drifted over, drawn by curiosity and perhaps by the smell of food. Her situation was not extreme in any way that would register in a crisis report. She was healthy, present, not visibly malnourished. She was, by Uganda's national poverty line of USD 1.77 per person per day, somewhere near the margin — perhaps just above it, perhaps just below it on the particular day I was there. Uganda's poverty trajectory from 2016 to 2024 is the story of millions of people at exactly that margin, moving gradually upward, disrupted by COVID, moving upward again.
Uganda's poverty reduction story is one of the more significant in sub-Saharan Africa over the period from independence through the early 21st century. The country exceeded its Millennium Development Goal poverty reduction targets — the headline poverty headcount rate fell faster than the MDG trajectory required over the 2000–2015 period. Since 2016/17, the period covered by the most recent National Household Survey cycle ending in 2023/24, the trend has continued but at a more moderate pace, reflecting the maturation of easy gains and the structural challenges of reaching the households that remain below the poverty line.
Understanding Uganda's poverty trends requires understanding the national poverty line. Set at USD 1.77 per person per day — approximately UGX 6,500/person/day at current exchange rates — it is calibrated to Uganda's cost of living and consumption patterns, not to the international extreme poverty line of USD 2.15/day. The national line anchors all Uganda household survey poverty headcount calculations and provides the standard against which the 2016/17 and 2023/24 UNHS results are compared.
The MDG Achievement and What Came After
Uganda's success in exceeding the Millennium Development Goal poverty reduction target was genuine and reflected real improvements in household welfare. The combination of sustained economic growth, the return to stability in northern Uganda after the LRA conflict ended in the mid-2000s, expansion of primary education and health services, and improvements in road infrastructure connecting rural producers to markets all contributed to poverty reduction that exceeded the international benchmark.
The 2016/17 UNHS established the baseline from which subsequent progress is measured. The 2023/24 UNHS — the most recent full cycle — shows continued reduction in the poverty headcount rate against the national poverty line, but at a more modest pace than the MDG period. This deceleration is expected: the households that move out of poverty first are those closest to the poverty line, with some assets and connections to markets. The remaining poor are more structurally constrained, and moving them above the poverty line requires more targeted and sustained intervention.
COVID-19 disrupted the trajectory. The 2020–2021 period saw poverty rates rise as Uganda's economy contracted sharply — the country had one of the most prolonged school closures globally during the pandemic, costing children nearly two full academic years, and economic activity in sectors dependent on movement and services collapsed. The recovery from 2022 onward brought poverty rates back toward the pre-COVID trend, but the COVID shock cost Uganda several years of progress and left a scarring effect, particularly on young people who lost schooling during critical years.
The Regional Dimension
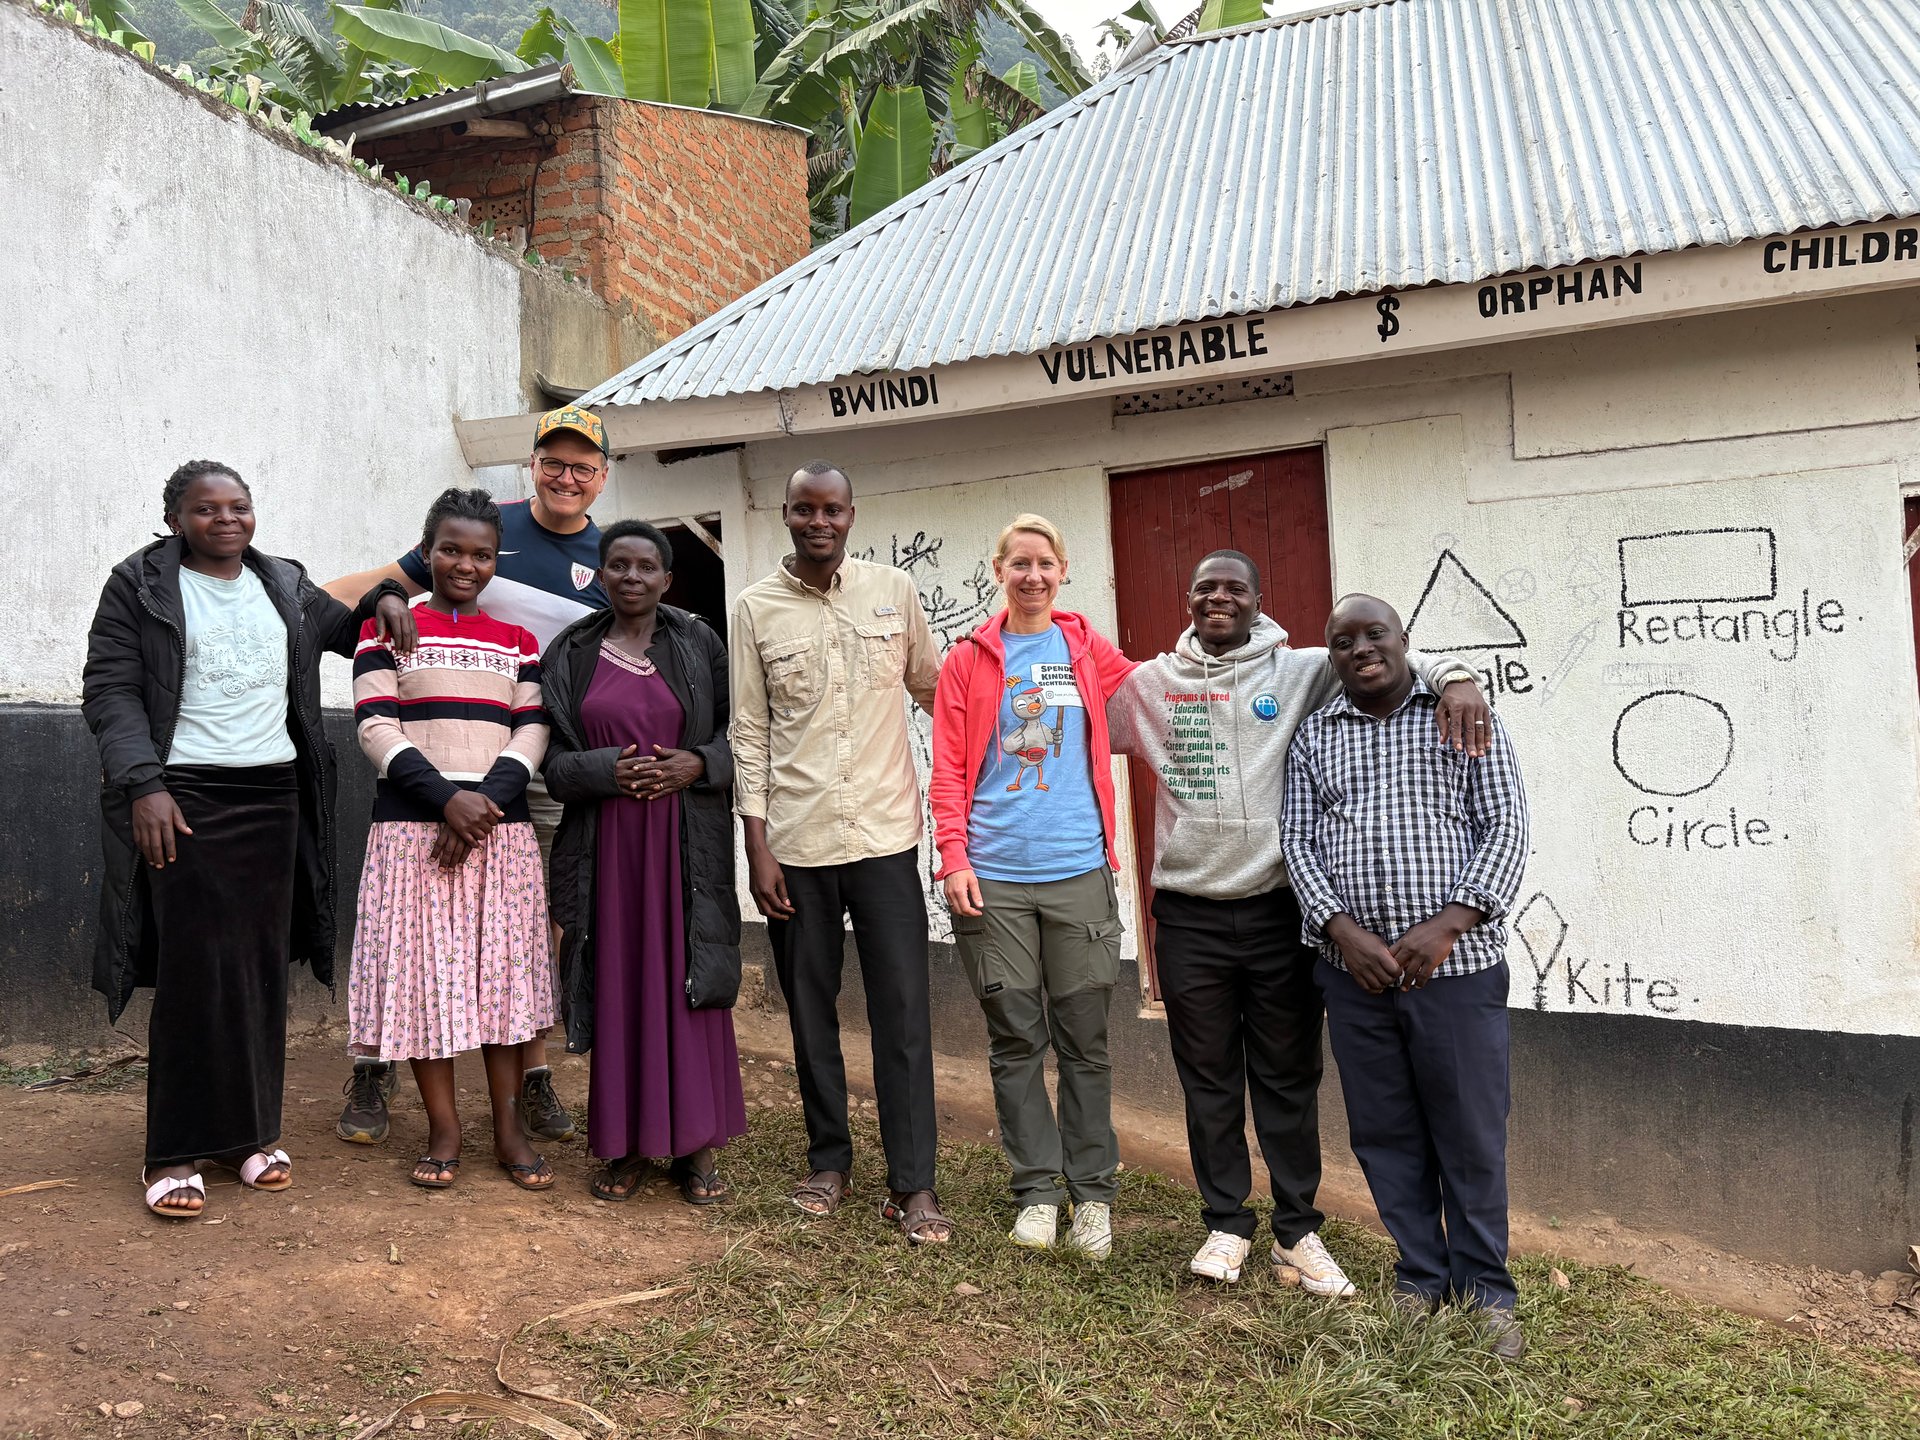
Uganda's aggregate poverty trend conceals sharp regional variation. The Central region, anchored by Kampala and the Buganda heartland, has poverty rates substantially below the national average. The Western region — which includes the southwest corridor from Fort Portal through Kabale, and communities like Buhoma near Bwindi — has benefited from tourism growth, relatively fertile land, and better road connectivity. It has seen consistent poverty reduction.
The Northern region, encompassing the areas most affected by the LRA conflict, has higher poverty rates and a poverty reduction trajectory that is positive but starting from a significantly lower base. Infrastructure built since the end of the conflict — roads, markets, electricity — has improved living standards, but the recovery from two decades of displacement and under-investment is measured in generations, not years. The Eastern region shows mixed results, with more developed areas near major roads improving and more remote areas lagging.
Karamoja in the northeast — a semi-arid pastoralist region that was until recently under a security-heavy development model — has the highest poverty rates in Uganda and has been the slowest to respond to national development investment. The 2024 National Population and Housing Census data for Karamoja underscores the persistence of structural poverty in areas where climate, geography, and governance history compound each other.
What the Subsistence Economy Measure Adds
The 2024 NPHC's finding that 33% of Ugandan households are in the subsistence economy is a complementary indicator to the consumption poverty headcount that the UNHS produces. A subsistence economy household is one whose primary activity produces for direct consumption — growing food to eat, not to sell. These households may or may not fall below the poverty line on a consumption measure, depending on the value assigned to own-produced food, but they have essentially no cash income and no financial resilience to shocks.
The trend from 2016/17 to 2023/24 on the subsistence economy dimension is one of gradual reduction — more households moving from purely subsistence farming toward some market integration — but the 33% figure in 2024 shows the task remaining. An economy where a third of households produce for consumption with no market participation is an economy where a third of households cannot benefit directly from aggregate economic growth. Growth that flows through markets and formal employment does not reach them.
Agricultural commercialization — connecting subsistence farmers to markets through improved roads, storage, aggregation, and price information — is therefore central to continuing poverty reduction beyond the gains already made. The Wakiso District Development Plan IV's infrastructure targets, replicated across Uganda's 146 districts, represent the district-level building blocks of this national agenda.
Population Growth and the Poverty Arithmetic
Uganda's population is projected to grow at 2.4% annually through 2040 — one of the faster growth rates in the region. This has direct implications for poverty reduction arithmetic. Even if the poverty headcount rate (the share of people below the poverty line) continues to fall, the absolute number of poor people may remain stable or even increase if population grows faster than the rate of poverty reduction. Uganda needs to reduce its poverty rate faster than 2.4% per year just to reduce the absolute number of poor people.
This is achievable with strong economic growth and effective targeting of that growth toward the households currently below or near the poverty line. Uganda's GDP growth target in its development plans is above 6% annually — if achieved and distributed more equitably than current Gini trends suggest, the poverty reduction arithmetic becomes favorable. The challenge is that population growth is concentrated in the age groups entering the labor market over the next decade, and Uganda's current trajectory of labor absorption (primarily into subsistence agriculture) does not provide sufficient productive employment for the cohort of young people entering working age.
From the field
Frequently asked questions
What is Uganda's national poverty line?
Uganda's national poverty line is USD 1.77 per person per day (approximately UGX 6,500/person/day). Households whose per capita consumption falls below this level are classified as poor in the National Household Survey methodology. A separate food poverty line captures households unable to meet minimum caloric requirements.
Has Uganda exceeded its Millennium Development Goal poverty targets?
Yes. Uganda exceeded its MDG poverty reduction targets — the national poverty headcount rate was reduced faster than the MDG trajectory required. This reflects sustained economic growth, post-conflict recovery in the north, and agricultural and infrastructure improvements over the 2000–2015 period. Since 2016/17, reduction has continued at a more moderate pace.
What explains Uganda's poverty reduction from 2016/17 to 2023/24?
Key drivers include sustained economic growth averaging 5–6% annually (pre-COVID), urbanization bringing more households into the cash economy, agricultural commercialization in some regions, improved road connectivity, and service sector expansion. COVID-19 disrupted this trajectory in 2020–2021, but progress has resumed since 2022.
What regions of Uganda have the highest poverty rates?
Northern and Eastern Uganda have consistently higher poverty rates than Central and Western regions. Karamoja in the northeast has the highest poverty rates nationally. Northern Uganda is still recovering from the LRA conflict that ended in the mid-2000s. The Central region, anchored by Kampala, has poverty rates substantially below the national average.
Does Uganda's low unemployment rate reflect low poverty?
No. Uganda's 2.7% unemployment rate reflects the ILO definition, which counts subsistence farmers as employed. The poverty headcount rate measured against the USD 1.77/day poverty line and the 33% of households classified as subsistence economy participants are more relevant welfare indicators. Full employment in the technical sense coexists with widespread subsistence dependency.