Overview
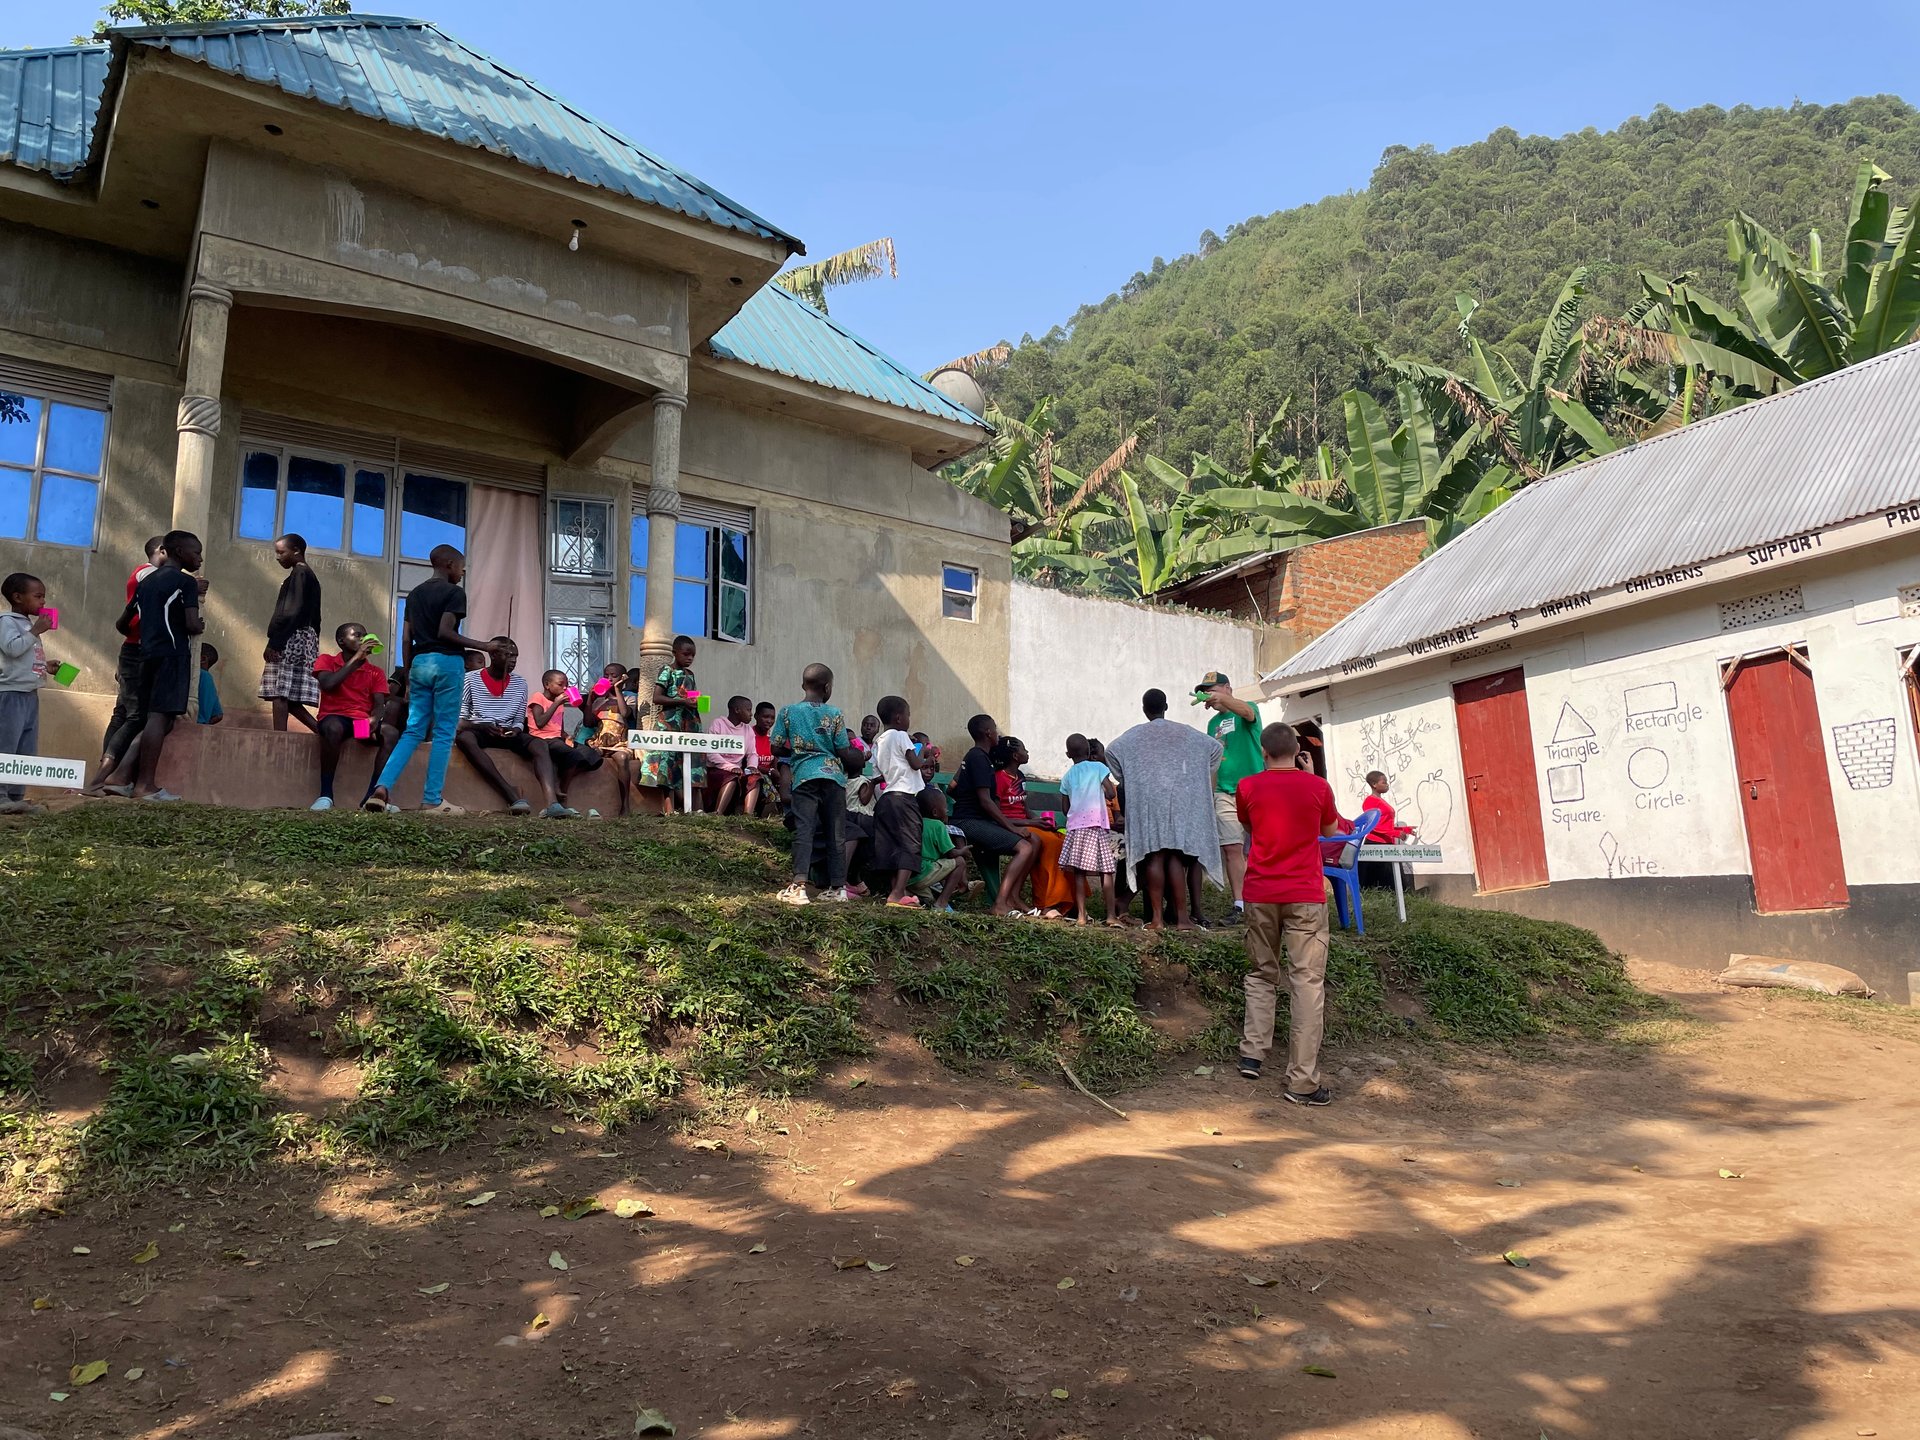
In January 2026, I visited the orphanage in Buhoma. It looks larger from the outside than it is. The main building has three rooms, electricity but no running water, and an annex with a dormitory and an office. There is not enough indoor space, so everything happens outside — eating, homework, play — all on the same courtyard. The children living there depend on a system designed to catch people who fall between every other net. The Uganda Self-Reliance Index exists to measure, precisely and systematically, how many people that system is actually catching.
The UG-SRI is a biennial tool that tracks the progress of both refugee and host community households toward genuine self-reliance. It is unusual among monitoring frameworks in two respects: it covers both refugee and host populations (rather than focusing only on displaced people), and it takes a multidimensional view — measuring not just food security, but livelihoods, shelter, health, education, water, social protection, and social cohesion. The 2024 edition provides the most comprehensive picture yet of where two million refugees and their surrounding communities actually stand.
The 2024 UG-SRI was updated as of December 2024 and broken down by settlement and population type. Its headline food security finding — that 66% of households had an Acceptable Food Consumption Score — is the kind of statistic that can be read two ways. Optimistically: two thirds of households are meeting minimum dietary standards in what is one of the world's most resource-constrained humanitarian settings. Critically: one third are not, and the coping strategy data tells a more fragile story than the headline suggests.
The Eight Domains and Why They Matter Together
Earlier generations of refugee self-reliance programming tended to focus narrowly on agriculture: provide seeds, tools, and fertilizer; measure food production; declare success or failure. The UG-SRI reflects a more sophisticated understanding developed through decades of programming experience — that a household which can grow food but cannot afford healthcare, school fees, or a roof repair is not genuinely self-reliant. Shocks in any single domain cascade into others.
The eight domains that the UG-SRI tracks are: food security (dietary adequacy and frequency); livelihoods and income (employment, self-employment, asset accumulation); shelter (structural quality, overcrowding, tenure security); health (access to facilities, treatment-seeking behavior); education (enrollment and attendance across age groups); water, sanitation, and hygiene (quantity, quality, and access); social protection (access to safety nets and formal support); and social cohesion (relations between refugees and host communities).
These domains interact in ways that make siloed measurement misleading. A household in Rhino Camp that grows enough food but has no cash income cannot buy medicine when a child falls ill. A household in Nakivale with reasonable income but insecure shelter loses assets when the rains come. Social cohesion — the quality of relationships between refugee and host community households — affects market access, dispute resolution, and the willingness of host communities to support rather than resist the continued presence of refugees. The UG-SRI attempts to capture this complexity systematically.
Food Security: The Gap Behind the Headline
The 66% acceptable Food Consumption Score means that two thirds of households consumed food of adequate diversity and frequency during the measurement period. The Food Consumption Score is calculated from a 7-day dietary recall, weighted by nutritional value. A score above a certain threshold is classified as acceptable; below it, borderline or poor.
What the food consumption headline does not capture is the sustainability of current food access. The coping strategy indicators do. A household using stress coping strategies has started depleting reserves — selling productive assets, reducing meal frequency, borrowing — to maintain food consumption. Stress strategies keep the FCS acceptable today at the cost of future resilience. Of the households measured in December 2024, 31% were in this position.
Crisis coping strategies are more severe: eating seed stocks, removing children from school to work, accepting extremely precarious employment. Twelve percent of households had reached this level. Emergency strategies — begging, engaging in socially unacceptable or risky activities — affected 6% of households. Together, 49% of households were either below acceptable food consumption or maintaining it through coping strategies that were undermining their long-term position. This is the fuller picture behind the 66% headline.
Livelihoods: The Eight MSD Programmes
In late 2024, eight Market Systems Development programmes were operational in Uganda's refugee response. Seven targeted agricultural markets — connecting refugee and host-community farmers to input suppliers, buyers, and financial services. Two implemented graduation approaches: structured programmes designed to move the most vulnerable households systematically from dependency to self-sufficiency through a combination of cash transfers, asset provision, savings group membership, and livelihood coaching.
Market-based programming represents the evolution of thinking about how self-reliance is achieved. Rather than providing direct services indefinitely, MSD programmes invest in the systems through which people meet their own needs: the markets where they buy inputs, the aggregators who buy their produce, the financial services that allow them to save and invest. When these systems work, they benefit refugees and host communities simultaneously — and they continue to function after programme funding ends.
The challenge is timescale. MSD programmes require three to five years to demonstrate results at scale. They require multi-year funding commitments from donors who are under pressure to show short-term impact. In the 2024–2025 funding environment, where the UCRRP received roughly 22% of its total request, the tension between long-term market investment and immediate humanitarian need was acute.
Settlement-Level Variation
The UG-SRI's settlement-level disaggregation reveals variation that national averages conceal. Nakivale, as Uganda's oldest settlement with the most established refugee community, shows relatively stronger livelihoods indicators than newer settlements like Palabek or Imvepi in the north. Kyangwali in the west, which hosts Congolese refugees with long-standing farming traditions, shows different patterns than Rwamwanja, which has a more mixed population profile.
Population type disaggregation — comparing refugee and host community households — consistently shows that the two groups face similar structural challenges even when their immediate circumstances differ. Host community households near large settlements often show food security indicators similar to or worse than those of the refugees they live alongside, reflecting the pressure that settlement populations place on shared resources and local markets. This is one reason Uganda's policy integrates host community support into refugee programming rather than targeting refugees exclusively.
Water Access as a Diagnostic
One data point from the broader monitoring system captures the operational reality vividly. The minimum standard for water provision in humanitarian settings is 15 litres per person per day — enough for drinking, cooking, and basic hygiene. In at least one reception centre tracked in mid-2026, the actual provision was 14 litres per person per day — 1 litre short of the minimum.
One litre sounds small. In practical terms it is the difference between being able to wash hands before meals and not, or between having enough water to cook a full meal and rationing. More importantly, it signals that the gap between standard and reality is present everywhere in the system — in reception centres, in permanent settlements, in host community boreholes shared with refugee populations. The UG-SRI's water and sanitation domain attempts to track this systematically across all settlement locations.
What Progress Looks Like
Despite the constraints, the UG-SRI documents genuine progress in specific domains. School enrollment rates among refugee children in settlements have improved substantially over the past decade, supported by Uganda's integration of refugee children into the national school system. Social cohesion indicators in most settlements remain positive — tensions exist, but they are managed rather than explosive. Shelter quality has improved in established settlements where refugees have had time to build more permanent structures.
Self-reliance programming has evolved from narrow agricultural focus to multidimensional frameworks. This evolution reflects real organizational learning — the recognition that food security, livelihoods, health, and social protection are interconnected systems, not separate interventions. The UG-SRI is both the measurement of this complexity and part of the system that generates learning about how to address it.
From the field
Frequently asked questions
What is the Uganda Self-Reliance Index?
The Uganda Self-Reliance Index (UG-SRI) is a biennial measurement tool tracking refugee and host community household progress across 8 domains: food security, livelihoods, shelter, health, education, water and sanitation, social protection, and social cohesion. Results are disaggregated by settlement and population type.
What did the 2024 UG-SRI find about food security?
In December 2024, 66% of households had an Acceptable Food Consumption Score. However, 31% were using stress coping strategies, 12% crisis-level, and 6% emergency-level — meaning nearly half of households were either below food standards or maintaining consumption by depleting future resilience.
How many domains does the Uganda Self-Reliance Index cover?
The UG-SRI covers 8 domains: food security, livelihoods and income, shelter, health, education, water and sanitation, social protection, and social cohesion. The multidimensional approach reflects evidence that narrow single-domain interventions fail to produce durable household resilience.
How does Uganda's self-reliance programming work?
Self-reliance programming has evolved from agricultural input provision to multidimensional market-based approaches. Eight Market Systems Development programmes were operational in Uganda in late 2024, seven targeting agricultural markets and two implementing graduation approaches that move households systematically from dependency toward self-sufficiency.
How many refugees does Uganda host in total?
As of June 2026, Uganda hosts 2,031,697 refugees and asylum seekers — the largest refugee-hosting population in Africa. South Sudan accounts for approximately 52% and DR Congo for approximately 33% of the total.